01 · Nitrogen
pH above 8, 69.1% of samples
the condition · from the survey
“Above pH 8, surface urea leaves as ammonia before the crop can use it. What dissolves moves down with the irrigation water.”
From van.com.pk · Home · the 3 losses

VAN built these maps from the data, so the soil can be seen, and answered.
▸ The map plays through 8 readings, then rests on phosphorus. Pick a reading, hover a square for its district and value, tap one to hold that district.
Every square is the median of the georeferenced samples inside it, no boundary file, no interpolation. Switch the analyte and watch the same ground re-colour. 4,911 cells of 0.05°, no district polygons.
Source · Punjab soil testing programme · 36 district workbooks · 770,160 valid samples · c. 2016–2018. Read this before quoting ›
Sulfur has no map, because it was never measured. See the analyte list below.
Punjab tested 770,160 soil samples for pH, organic matter, phosphorus, potash, calcium carbonate and 5 micronutrients. Read together, they describe one soil: alkaline, calcareous, almost without carbon, short of phosphorus, potash, zinc and boron in most of them, and never tested for sulfur.
VAN feeds the soil as well as the crop.
8 things VAN already makes or already publishes against the condition these samples describe. Each one goes somewhere.
The large figure is the share of samples past Punjab's own working threshold. The chip classifies the province median, the typical field, against VAN's 5-band soil-test table, the same one printed on a VAN soil report. The mean is shown beside it; a few very high samples pull the mean up. 2 different questions, so the share and the chip can disagree, and where they do the tile says so.
Source · Punjab soil testing programme · 36 district workbooks · 770,160 valid samples · c. 2016–2018. Deficiency shares are of samples below Punjab’s working thresholds, not a diagnosis of any field. Read this before quoting ›
Punjab, and only Punjab. All 770,160 samples come from the province's own 36 district workbooks. Sindh, Khyber Pakhtunkhwa and Balochistan were never surveyed at this depth, which is itself a finding about how Pakistan knows its own soil. Punjab carries most of the country's cropped area, so Punjab's figures carry the national argument, though they are not national figures.
The map: 8 readings, one ground, in 2 groups: the 4 a partner formulates against, and the 4 that describe what those 4 land in. The readings above and the matrix below both drive it.
Every district a row, every parameter a column, every cell on VAN's own 5-band scale. Sort by a column to see who is worst on it, search for your own, and tap a cell to take that district and that parameter to the map above.
| 770,160 | ||||||||
|---|---|---|---|---|---|---|---|---|
| 13,330 | ||||||||
| 23,220 | ||||||||
| 16,700 | ||||||||
| 27,063 | ||||||||
| 14,037 | ||||||||
| 17,935 | ||||||||
| 8,536 | ||||||||
| 26,676 | ||||||||
| 12,002 | ||||||||
| 27,501 | ||||||||
| 28,703 | ||||||||
| 20,887 | ||||||||
| 11,963 | ||||||||
| 51,556 | ||||||||
| 24,614 | ||||||||
| 28,233 | ||||||||
| 18,131 | ||||||||
| 10,752 | ||||||||
| 31,103 | ||||||||
| 14,757 | ||||||||
| 13,231 | ||||||||
| 25,557 | ||||||||
| 42,094 | ||||||||
| 23,642 | ||||||||
| 33,871 | ||||||||
| 31,684 | ||||||||
| 19,972 | ||||||||
| 9,396 | ||||||||
| 25,164 | ||||||||
| 14,757 | ||||||||
| 21,511 | ||||||||
| 11,092 | ||||||||
| 12,032 | ||||||||
| 20,392 | ||||||||
| 12,869 | ||||||||
| 25,197 |
The bands are VAN's own 5-band soil-test table, the same one printed on a VAN soil report, read against the district median, the typical field; the mean sits under each value. Calcium carbonate has no row in that table, so it carries a value and no colour. Copper and manganese have 3 bands there rather than 5. N.d. = not determined; Jhelum returns no valid zinc. * Iron and copper in Faisalabad, Jhang, Chiniot and Toba Tek Singh read far below every other district, which points to a different laboratory method rather than different soil. They are shown as surveyed and not banded. Tap any cell to take that district and that parameter to the map and the readings above.
shares of samples, not a diagnosis of any field
share of samples by class
Source · Punjab soil testing programme · 36 district workbooks · 770,160 valid samples · c. 2016–2018. Thresholds: Punjab working thresholds: organic matter low < 0.86%, available P low < 7 ppm (adequate ≥ 15), available K low < 180 ppm, Zn low < 1.0 ppm, B low < 0.5 ppm; EC > 4 dS/m saline. Read this before quoting ›
The survey is not only district averages. It carries 4,911 cells of about 5.5 by 4.8 kilometres, roughly 6,600 acres each, and every district has its own. That is closer to a neighbourhood than to a district, and it is where a district average starts to fall apart.
Pick what to group the samples by and what to read across the groups. Where the evidence page recorded a verdict, it is shown as written. Including the one that does not hold.
979 samples below pH 7.0 are not drawn (the 4 bands shown carry 99.9% of the province).
Province series · 3.41 → 4.86 → 6.91 → 7.41 % CaCO₃
Mean calcium carbonate rises monotonically across every pH band. The alkalinity is calcareous in origin, exactly as expected.
Source · Punjab soil testing programme · 36 district workbooks · 770,160 valid samples · c. 2016–2018. Observational; establishes conditions, not mechanism. Read this before quoting ›
These are observational district data, not a controlled experiment. 2 relationships hold cleanly, 1 holds with a limit, 1 is reported without explanation, and 1 widely-assumed relationship does not appear. Stated here because it is the one a technical reader will look for.
A projection from the 2016-18 soil tests, on VAN’s own soil scale. Move the year to see the best, average and worst case.
In 2026, if nothing changes: average case 116 ppm (Average), worst case 102 ppm (Average), best case 120 ppm (Average). The average case drops from Average to Weak around 2036; worst case 2027; best case 2044.
Punjab soil potash (ppm, available K) projected from the 2016-18 soil tests of 770,160 samples. The coloured bands are VAN's own soil-test scale, the one printed on a VAN soil report: Critical below 50 ppm, Weak 50 to 100, Average 100 to 150, Moderate 150 to 200, Healthy above 200. 100 ppm is where soil moves from Average to Weak. Best and worst case: a 1 in 10 chance the result is better or worse.
Source: Tahir Abbas, Soil Poverty Series No. 1, Punjab's Potash (2026). Start 130 ppm, weighted by cultivated area. Rate of loss set to SFRI monitoring sites, 2003-09. Projections, not measurements.
Every district workbook carries the same 13 columns, and sulfur is not one of them. The nutrient VAN’s programmes place twice in wheat alone was never on the testing schedule.
Sulfur appears in no district file, in no column, at any point in the sampling programme. Sulfur was left off the testing schedule, so no result for it exists. Because it is never measured, it is never reported as deficient and it never enters a fertiliser plan.
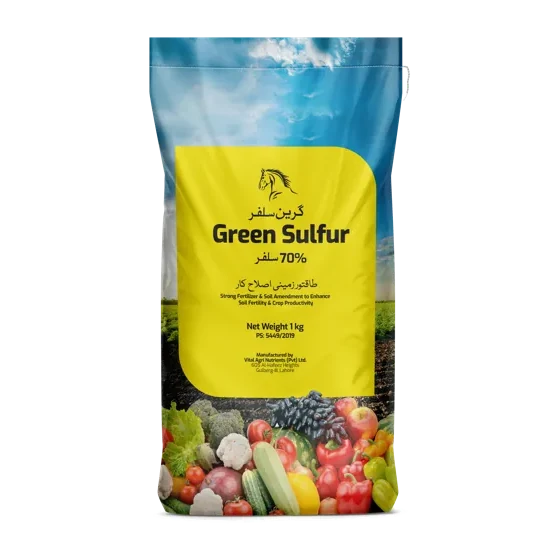
Sulfur is in VAN’s published programmes. The wheat plan alone places Green Sulfur at germination and again at early growth. Sulfur appears in none of the 770,160 determinations.
Source · Punjab soil testing programme · 36 district workbooks · 770,160 valid samples · c. 2016–2018. Copper, iron, manganese and saturation percentage are province means from the same module. Texture is the share of the commonest recorded class, out of the 757,563 samples that carry a texture class at all; 12,597 of the 770,160 do not, and are not counted either way. Read this before quoting ›
The survey gives the condition. The mechanism sentences are VAN’s own published copy. No performance figure is claimed for any product.
“Above pH 8, surface urea leaves as ammonia before the crop can use it. What dissolves moves down with the irrigation water.”
From van.com.pk · Home · the 3 losses
“Calcareous soil binds phosphate with free calcium and takes most of it back before the root arrives.”
From van.com.pk · Home · the 3 losses
“Pakistan applies 83 kg of nitrogen for every 1 kg of potash, so the crop draws potash from the soil’s own reserve.”
From van.com.pk · Home · the 3 losses
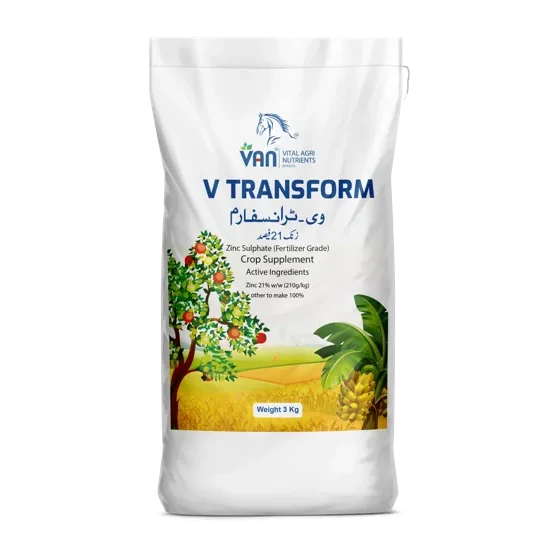
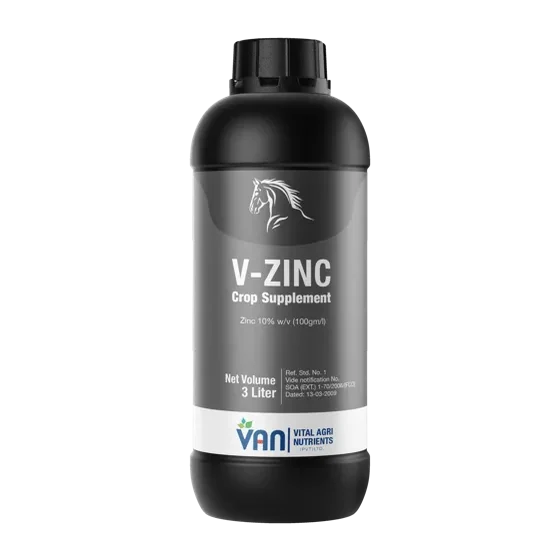
“In Punjab’s alkaline, high-pH soils, zinc is chemically fixed, making it unavailable to roots even when total soil Zn is adequate.”
From van.com.pk · Wheat programme · deficiency notes
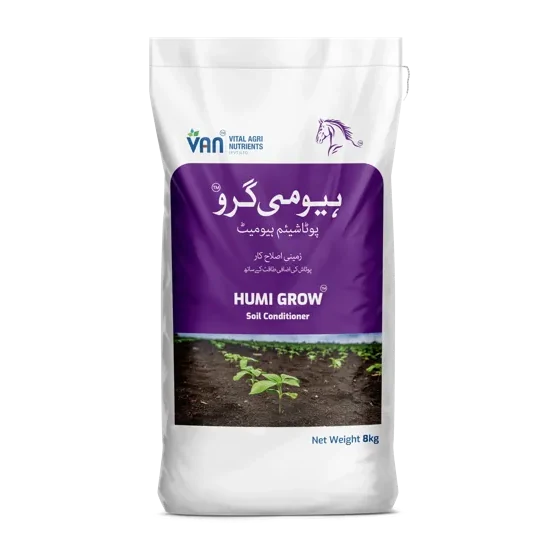
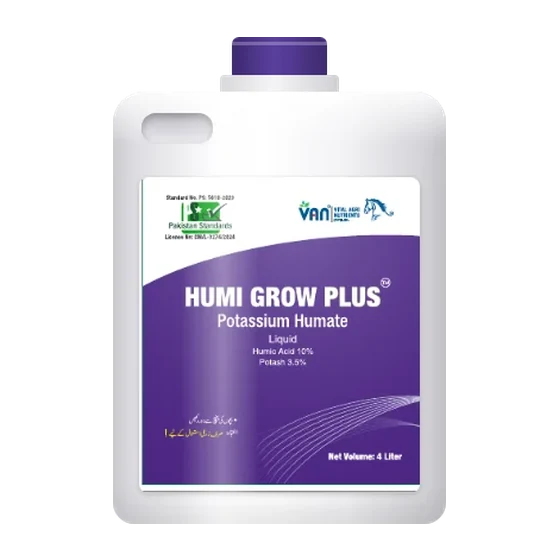
“Concentrated humate with fulvic acid and potash for fertigation and foliar use on soils under 1% organic matter.”
From van.com.pk · Formulation library · BIO-H50F
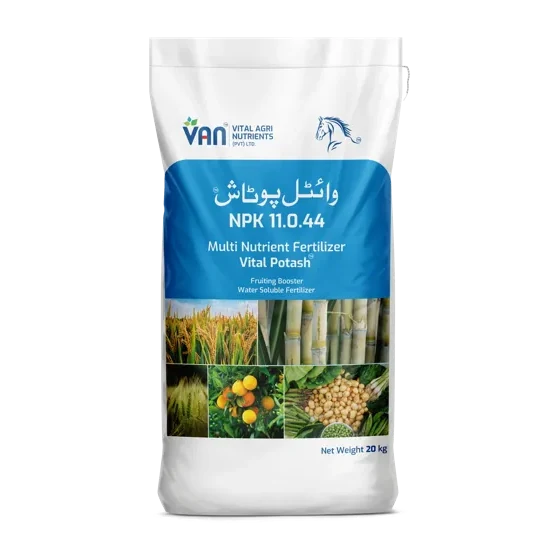
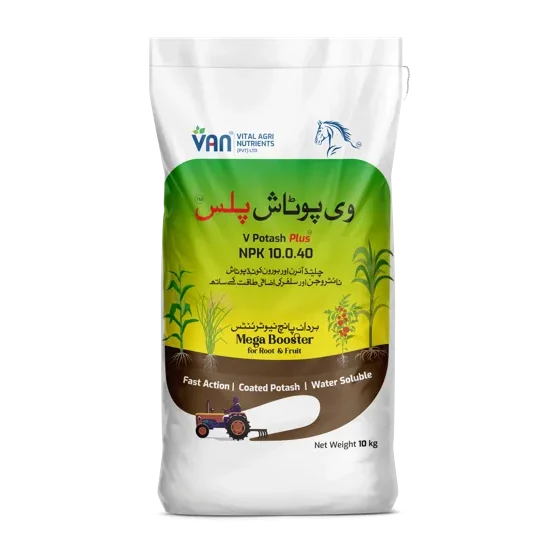
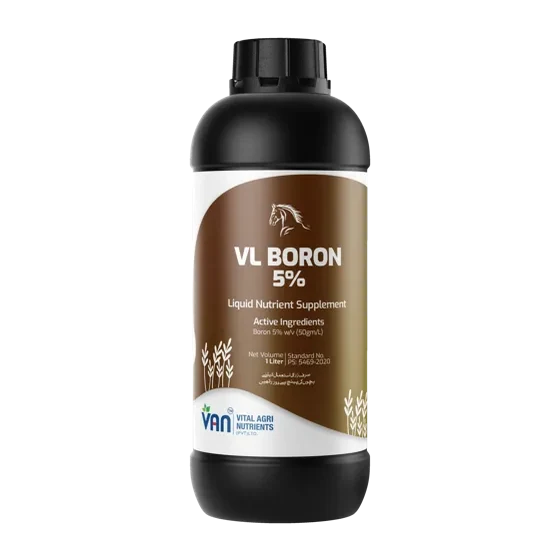
“Vital Potash, N 11 · K₂O 44, coated with boron in 2 forms.”
From van.com.pk · Products
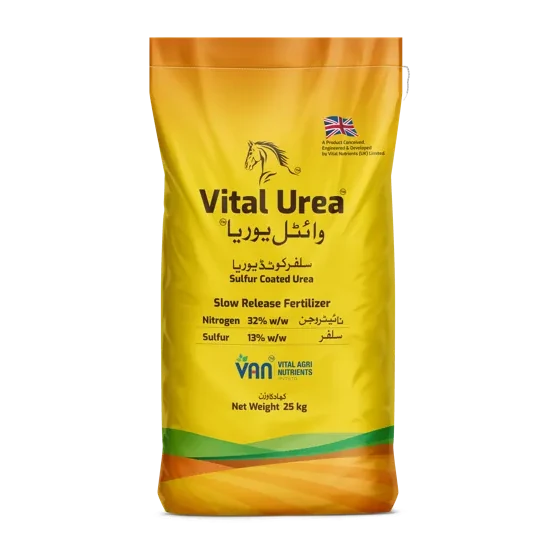
“Sulfur Coated Urea · N 32% min · S 13% min. Green Sulfur · Sulfur 70% WDG.”
From van.com.pk · Products
The survey gives the condition. The mechanism sentences are VAN’s own published copy. No performance figure is claimed for any product. Condition figures: Punjab soil testing programme · 36 district workbooks · 770,160 valid samples · c. 2016–2018.
Punjab's ground is alkaline and calcareous. 96.1% of samples above pH 7.5, mean carbonate 6.53%. On that soil, nutrient applied per acre has risen by 68% since 2000 while wheat yield rose by 31%. Roughly 1 kg of applied nitrogen in 4 reaches the crop.
What changes the outcome is the form the nutrient arrives in and where it is put, not the tonnage.
The nutrition Pakistan pays for →A report by Tahir Abbas built on this Atlas: what 5 crops take out of Punjab’s soil each year, what fertilizer, manure and water put back, and when the Punjab average falls below 100 ppm if nothing changes.
Read the report →36 district workbooks from the Punjab soil testing programme, each row one georeferenced sample carrying district, tehsil, markaz, union council and mauza identifiers alongside the laboratory determinations. Every row was read; no sub-sampling. Records without a valid pH were excluded; 770,160 remained. Province figures are weighted by district sample count.
The sampling window is roughly 2016–2018. These figures describe a structural baseline, not present-day status.
Survey data with no controlled treatments. It establishes conditions with very high confidence. It cannot establish mechanism, for that, controlled and peer-reviewed work is the appropriate evidence.
Deficiency shares use Punjab’s working thresholds: organic matter below 0.86%, available phosphorus below 7 ppm (adequate at 15), available potash below 180 ppm, zinc below 1.0 ppm, boron below 0.5 ppm.
The Sheikhupura workbook carries a duplicated header column; it was re-parsed with the offset corrected. Jhelum returns no valid zinc data. Physically impossible values were bounded before averaging.
Bounds and repairs, as recorded in the module. Punjab soil testing programme, 36 district workbooks, georeferenced to plot level, sampling window c. 2016–2018; every row read, no sub-sampling; records without a valid pH excluded; physically impossible values bounded before averaging (pH 0–14, OM 0–10%, P 0–200 ppm, CaCO3 0–100%, K 0–3000 ppm, Zn 0–50 ppm, B 0–20 ppm, EC 0–100 dS/m). Province figures weighted by district sample count. Sheikhupura workbook re-parsed with its duplicated header column corrected. Jhelum returns no valid zinc data. Sulfur is not determined in any file.
Thresholds. Punjab working thresholds: organic matter low < 0.86%, available P low < 7 ppm (adequate ≥ 15), available K low < 180 ppm, Zn low < 1.0 ppm, B low < 0.5 ppm; EC > 4 dS/m saline.
770,160 valid samples across 36 districts. Analytes determined: Saturation percentage · Texture class · Electrical conductivity · pH · Organic matter · Phosphorus (available) · Potash (available) · Calcium carbonate · Zinc · Copper · Iron · Manganese · Boron. Not determined: Sulfur.
These are district means over samples taken c. 2016–2018. For a plan against your own field, VAN works from your soil analysis. Ask on WhatsApp, or send 500 g of soil to Sample Reception.