
Crop Plans / Cereals & field crops / Maize (Corn)
Crop programme · per acreMaize (Corn)
The full stage-by-stage programme is below and in the PDF: what to put on, at which stage, by which method, and the pack it comes in. The programme is VAN’s published plan. The nutrition calculator further down reads VAN’s own maize calculator. Where the 2 differ, the page shows a range.
When did you sow?
Answer this and the page orders itself around your field. Skip it and nothing is lost, every rate, quantity and method below is exactly where it was.
Every band, every stage.
The programme matrix. Every band across every stage, per acre, with commodity inputs greyed and every product shown as its real pack.
| Band | Land Preparation | Germination | Early Growth | Grand Growth | Maturity |
|---|---|---|---|---|---|
| Phosphorus | 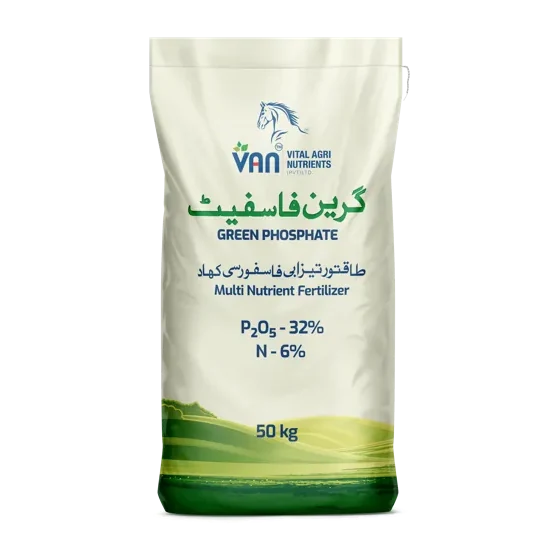 Green Phosphate P₂O₅ 32% · N 6% · 1.5 bag · 50 kg Drill at sowing; broadcast if no drill or Fusion Phosphate. Your choice | 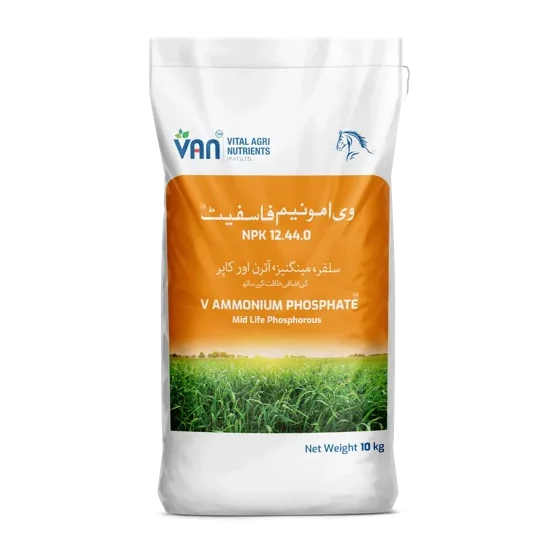 | |||
| Nitrogen | 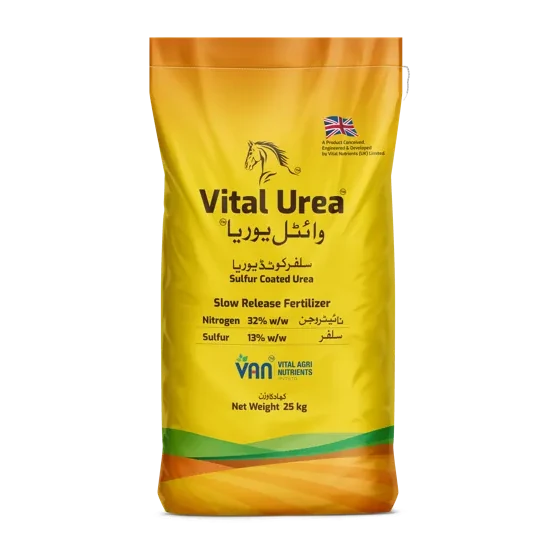 | Urea N 46% · ½ bag · 50 kg Side Dressing/Placement | Urea N 46% · 1 bag · 50 kg Fertigation | Urea N 46% · 1 bag · 50 kg Fertigation | |
| Potash | 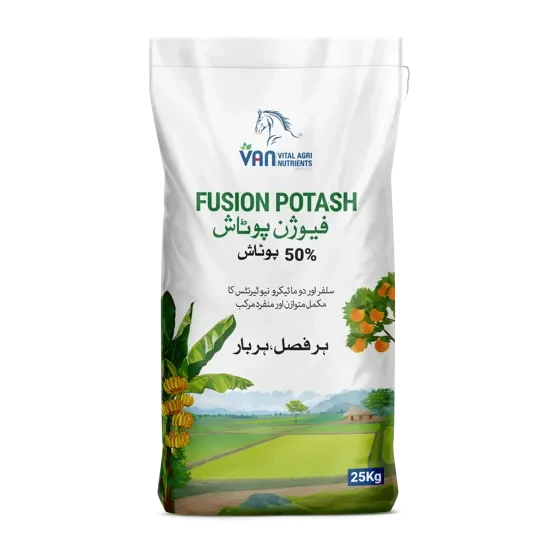 | 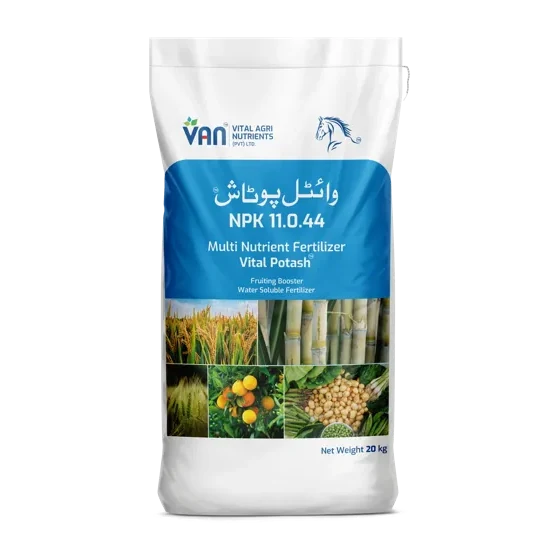 | | ||
| Secondary Nutrient | 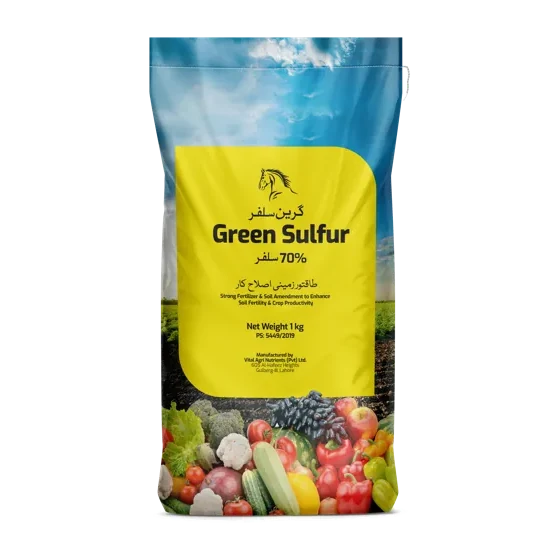 | | 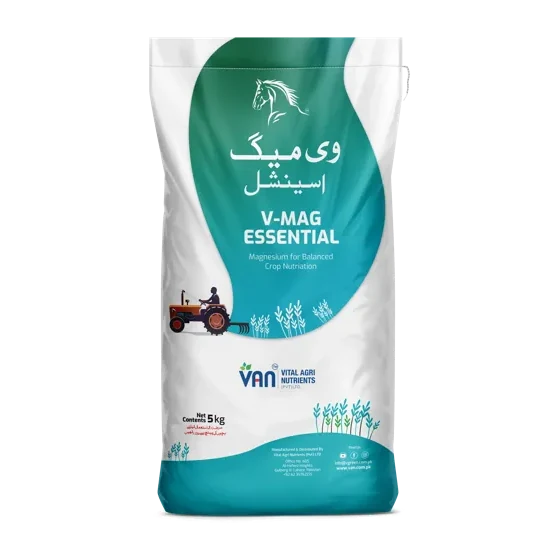 | | |
| Soil Amendment | 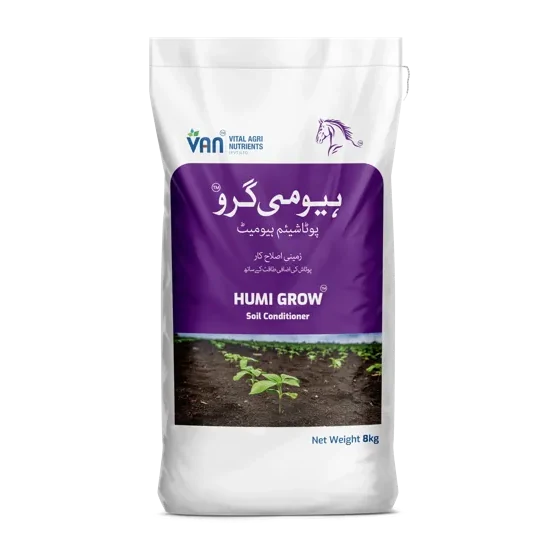 | 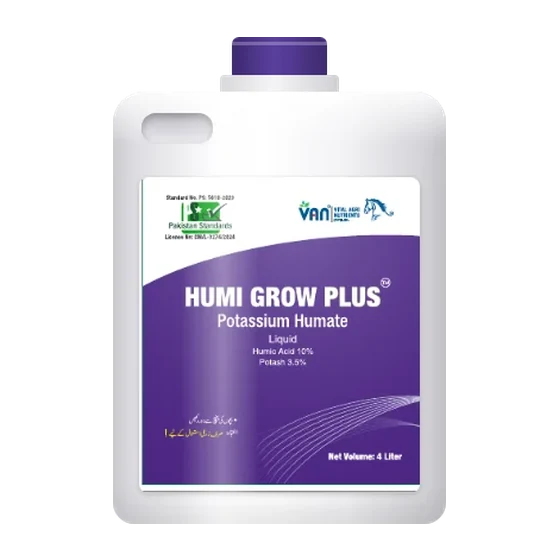 | |||
| Micronutrients | 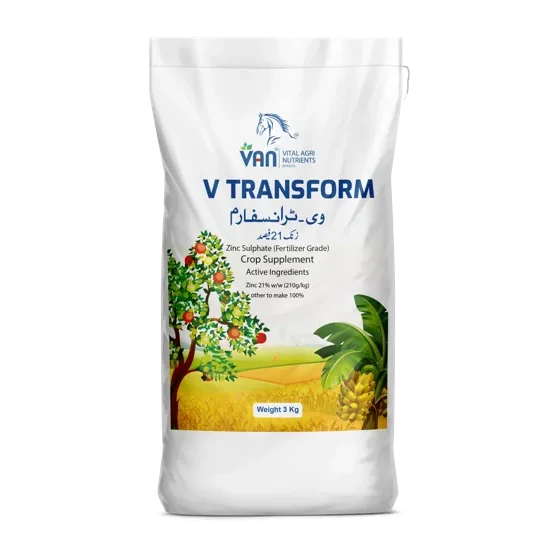 | 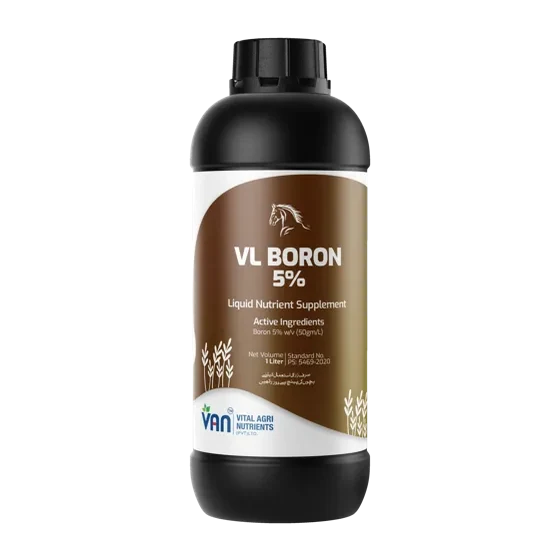 |
What to buy for your acres.
Tick the stages you are planning, set your acres, and this is the maize programme turned into bags and packs. Published rate multiplied by your acres, no estimate in between.
Tick the stages. Set your acres. Send the list.
Counts are the published per-acre rates added up across the stages you tick, multiplied by your acres. VAN confirms the final price, availability and delivery on WhatsApp.
- Green Phosphate50 kg bag · Land Preparation1½bags · 75 kgYour choice:
Same bag size, different bag. Fusion Phosphate is TSP at 46% P₂O₅. About 44% more phosphate per bag than Green Phosphate’s 6-32-0, and no nitrogen with it. Green Phosphate is the humic-coated acidic grade, built for alkaline ground. The plan’s number of bags does not change if you switch; what you put on the field does. At 50 kg a bag: Green Phosphate 16.0 kg P₂O₅ + 3.0 kg N, Fusion Phosphate 23.0 kg P₂O₅ and no nitrogen.
- V. Ammonium Phosphate (V-Phosphate)10 kg bag · Grand Growth1bag · 10 kg
- Vital Urea25 kg bag · Land Preparation, Germination2bags · 50 kg
- Fusion Potash25 kg bag · Land Preparation½bag · 12.5 kg
- Vital Potash20 kg bag · Grand Growth, Maturity1bag · 20 kg
- Green Sulfur20 kg bag · Land Preparation, Germination½bag · 10 kg
- V-Mag Essential5 kg bag · Early Growth, Grand Growth2bags · 10 kg
- Humi Grow8 kg bag · Land Preparation1bag · 8 kg
- Humi Grow Plus4 L pack · Germination2packs · 8 L
- V-Transform3 kg bag · Germination1bag · 3 kg
- VL-Boron1 L pack · Grand Growth1pack · 1 L
- Urea not a VAN productcommodity input · 50 kg bag · Germination, Early Growth, Grand Growth2½bags · 125 kg
The message carries the list above. Add your district and VAN replies with price and the nearest dealer.
The dynamic nutrition creator.
Set your acres and every quantity below scales with it. Sourced straight from VAN's own maize calculator, not estimated.
Which list to use: the acres figure is shared with the shopping list above. The shopping list is the published plan; this list is VAN’s calculator, and it is the one to use if you have a soil report. Where the 2 differ, the totals below show a range.
Set your acres. Watch the plan scale.
Every quantity below comes straight out of VAN's own maize calculator, scaled by your acres, not estimated. Add your soil test below, or just pick your district, to adjust it further.
- Vital Urea25 kg pack250 kg total
- Ureanot a VAN product50 kg pack2.5125 kg total
- V. Ammonium Phosphate (V-Phosphate)10 kg pack110 kg total
- Green Phosphate50 kg pack1.575 kg total
- Vital Potash20 kg pack120 kg total
- Fusion Potash25 kg pack0.512.5 kg total
- VL-Boron1 L pack11 L total
- V-Transform3 kg pack13 kg total
- V-Mag Essential5 kg pack15 kg total
- Green Sulfur20 kg pack0.510 kg total
- Humi Grow8 kg pack18 kg total
- Humi Grow Plus4 L pack28 L total
| N | P₂O₅ | K₂O | |
|---|---|---|---|
| This plan | 81 | 28 | 16 |
| Recommended, less fertile soil | 119 | 69 | 50 |
| Recommended, average fertile soil | 92 | 58 | 37 |
| Recommended, very fertile soil | 75 | 46 | 25 |
kg in total. The recommended dose is the general figure in VAN’s own calculator sheet for this crop. VAN’s plan puts on less than it on most nutrients because VAN’s products lose less of what is applied, so the crop needs less of them for the same result.
A figure written as a range has 2 VAN documents behind it: VAN's maize calculator sheet and VAN's published maize plan, which do not carry an identical product list on this crop. Which of the 2 is higher depends on the nutrient. Both ends are arithmetic on VAN's own printed analyses. Nothing here is estimated.
Type the number from your soil report, or pick its band, for any of these. The plan above adds product where your land is short. For phosphorus, potash and zinc it takes a quarter off where your reading is healthy, never on nitrogen. Leave a row blank if you have no reading for it. This adjustment is a pilot.
VAN confirms the final price, availability and your nearest dealer on WhatsApp.
What goes on, and what comes off.
Every season takes nutrients out of the field in the harvest. The programme puts some back. This is both sides of that, per acre, for maize, and the gap is the reason this site argues about soil the way it does.
Put your expected yield in and both sides appear. Until then, here is what the programme itself delivers.
| Nutrient | The programme puts on | The harvest takes off | Balance |
|---|---|---|---|
| Nitrogen (N) | 81.5 kg | n/a | n/a |
| Phosphate (P₂O₅) | 28.4 kg | n/a | n/a |
| Potash (K₂O) | 15.9 kg | n/a | n/a |
| Sulfur (S) | 13.7 kg | n/a | n/a |
Why some figures are a range. Where a figure is shown as a range, it is because VAN holds 2 documents for this crop: the crop calculator sheet and the published crop plan. They do not carry an identical product list, so they do not deliver an identical kilogram of nutrient. Both ends are VAN’s own arithmetic on VAN’s own figures and neither is estimated.
Per acre, per season. A minus means the crop takes more of that nutrient off the field than the programme puts back. The difference comes out of what the soil already holds, and does so every season. It is not a fault in the plan: no crop nutrition programme is written to replace everything a harvest removes, and this is why a soil test matters more than any published rate.
Liquid packs are counted at 1 litre to 1 kilogram. The plans give the pack in litres and the analysis as a percentage without saying whether it is by weight or by volume, so a density has to be assumed and 1.0 is it. Every liquid here is a micronutrient or a foliar at a litre or two an acre, so it moves the totals by a fraction of a kilogram.
Where these 2 sides come from, because they do not come from the same place. What goes on is VAN's own published maize plan. Its rows, its rates, its printed analyses. Multiplied out. Nothing is modelled. What comes off is not VAN's: no Pakistani nutrient-removal table exists on the public record, so these are the IPNI nutrient uptake and removal tables, metric edition 01/15 (North America), for “Corn grain / Corn stover per t of grain”, per tonne of grain. IPNI's own note applies and is worth repeating: “Reported nutrient removal coefficients may vary regionally depending on growing conditions. Use locally available data whenever possible.” A Pakistani measurement would replace these outright, and should.
How much water the maize season needs.
A nutrition plan only works if the crop gets its water. This panel shows what the season needs, what rain normally gives, and what must come from irrigation.
No sowing date given, so this counts from the middle of VAN’s published window (February). Answer the question at the top of the page and it uses your date instead.
Pick your district and the figures appear. They come from the nearest weather station with published normals, and the page tells you which one and how far away it is.
- It is not measured with the full equation. FAO’s standard method needs humidity, wind and solar radiation. The Pakistan Meteorological Department normals this site carries have temperature and rain and not those, so the reference figure uses Hargreaves, the method FAO itself gives for exactly this case. It is an estimate.
- It is probably on the low side for Punjab. FAO’s crop coefficients are published for a sub-humid climate. Its own caption says relative humidity around 45% and light wind. Punjab in the dry season is drier and windier than that, and FAO’s own correction for arid climates raises the coefficient. Applying that correction needs humidity and wind data this site does not have, so the figure above is closer to a floor than a ceiling.
- It is what the crop uses, not what you have to pump. Nothing here allows for what a watercourse loses on the way, for water running past the roots, or for the extra needed to leach a salty soil. And the rain shown is all the rain. How much of a July downpour a field actually keeps depends on your soil and your slope, and there is no honest way to work that out from here.
Method: FAO Irrigation and Drainage Paper 56. Crop evapotranspiration, Table 11 (lengths of crop development stages) and Table 12 (single crop coefficients). Temperature and rainfall: WMO Climatological Standard Normals 1991–2020 (1991–2020), Pakistan Meteorological Department. Normals, not this season. What a month is usually like, averaged over 30 years.
Nutrition decides about 1/4 of the yield. Sowing, seed, water, weeds and pests decide the rest. The farm discipline simulator scores a whole season across 10 levers, and it exists for wheat and potato, each with its own levers and its own weights. It is not offered on maize because wheat’s 10 levers do not apply to maize. Each crop needs its own. What is being built, and what each needs →
About a quarter of the nitrogen in the bag feeds the crop. The rest leaves as gas or drains past the root.
Why it goes, what VAN builds against each loss, and the 17 nutrients and the barrel that show where your own season leaks. Written once, with its sources.
The plan names a method for every row.
Broadcasting, placement, side dressing, fertigation and spray are 5 different things. Read what each one means before you open the PDF.
▸ Tap a method to read it
Spread evenly over the soil surface, before or at sowing, and worked in by tillage or by the first irrigation. For a basal granule it is the last choice: drill it if you can (D-207).
1 product rule overrides the table. Vital Urea is a coated slow-release urea and is applied by drilling at sowing (beside and below the seed, never touching it), by side dressing, or by broadcasting, never by fertigation. The fertigation rows in the nitrogen band are commodity urea, which is a different material.
VAN’s nitrogen products.
Programme focus: S-N-K. The PDF names which products go on, at which stage. These are the VAN products in those nutrient groups.
These are per-acre programmes, not a prescription for your field.
A nutrition plan is built on a typical crop and a typical soil. It is not a substitute for a soil test. VAN prepares farm-specific plans against a grower's own soil analysis, yield target and the other variables that decide a rate. Ask for one on WhatsApp or at kisan@van.com.pk.